- Septic, Success Stories


Earlier this year, vacation rental company, Lake.com, released a report ranking America’s “cleanest” and “dirtiest” lakes. The list placed Table Rock Lake at #10 on its “dirtiest lakes” ranking. [lake.com]
That result surprised many people who know and love Table Rock Lake, including us at H2Ozarks.
Table Rock Lake is a beloved natural resource and vital economic driver in the region. It also faces genuine water-quality challenges. The lake is impaired for elevated total nitrogen and chlorophyll-a, meaning it does not fully meet the applicable water quality standards for supporting aquatic life. Those concerns are real, and we are working with partners across the watershed to improve the lake’s water quality.
But, does that mean that Table Rock Lake can accurately be called one of the “dirtiest” lakes in America?
Answering that question requires more than looking at a headline. It requires us to think about how the authors of the report created the ranking, what the measurements actually tell us, and whether the evidence supports the stated conclusions.
Here, we answer these questions by applying an important skill that everyone should use when reading reports or encountering a bold claim – that is, asking good questions about the evidence before accepting the conclusions.
When you read a surprising headline or hear a bold claim, it’s always best practice to pause and think critically about what you’re being told. Here are three questions you can ask yourself:
Our team at H2Ozarks applied these questions to the Lake.com report.
The report was created by a vacation rental platform, Lake.com. Their stated mission is to bring families together — helping people find the perfect vacation home by a lake. They wanted to let their readers know what the “dirtiest and cleanest” lakes are.
Knowing who produced the report helps us understand its purpose and intended audience. But the quality of a report ultimately depends on the study data and methods.
Data and information are paramount to understanding the challenges we face in water quality – and essentially every facet of our lives. This study used reliable data from the National Water Quality Monitoring Council (NWQMC), which is an EPA-managed database for water quality collected by hundreds of different entities.
Many things can be used to evaluate water quality. This report looked at eight common parameters – dissolved oxygen, ammonia, phosphorus, turbidity, dissolved solids, sulfate, lead, and deviation from a pH of 7.
The report evaluated 100 large lakes across the U.S., but only 67 lakes had at least three of the eight measurements and qualified for inclusion in the analysis. The available measurements were then combined into a “pollution score” out of 10 and all lakes were ranked by that score.
What are some questions we should ask ourselves here? Does it make sense to rank lakes by water-quality measurements? Do those rankings actually reflect a “pollution score”? How do rankings address the natural variation in measurements across regions of the U.S.?
One of the most important considerations here is the difference between a ranking and a standards-based assessment of water quality. A ranking can answer: How do concentrations in this lake compare to other lakes? A standards-based assessment can answer: Does this lake meet the criteria established to protect its designated uses?
In the same way, one lake may rank lower than another for a particular measurement without exceeding a water-quality standard or being considered polluted.
States set water quality standards for different waterbodies depending on what the water is intended to be used for. This is the waterbody’s Designated Use, and different uses have different sets of criteria. For example, a measurement that is important for aquatic life might not be the same for evaluating a drinking water supply or waters safe for swimming.
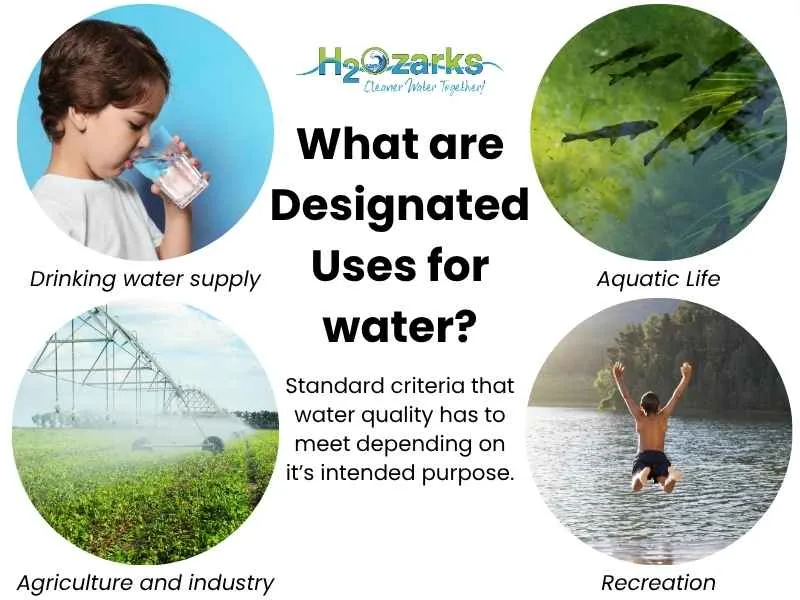
This is why conclusions about water-quality depend on the parameter, the waterbody, the designated use, and the applicable standard. You can learn about Missouri’s water quality standards in the Missouri Code of State Regulations (CSR), and Arkansas’s standards in the Code of Arkansas Rules (CAR).
Lakes in the Ozarks, which are surrounded by limestone and heavily forested landscapes, should not be expected to have the same measurements as a cold northern lake or a naturally saline (meaning salty) lake in the West.
The Lake.com report ranked the Great Salt Lake as the nation’s “dirtiest” lake, driven largely by its “extremely high mineral load”. But the Great Salt Lake is naturally saline. Its high concentration of dissolved minerals is a defining natural characteristic, not by itself evidence of human-caused pollution.
This demonstrates how important context is to environmental data. Raw numbers alone rarely tell the full story.
This leads us to a third, crucial question we can ask:
The report names Table Rock Lake as the tenth-dirtiest lake among the lakes it ranked. That conclusion is not supported by the analysis and results. The results show that Table Rock Lake ranked in the bottom 10 in terms of measurements. Results cannot be interpreted to mean that Table Rock Lake is objectively the tenth-dirtiest lake.
Dissolved oxygen (DO) measurements offer a useful example.
The Lake.com report lists Table Rock Lake’s average DO as 8.76 mg/L (milligrams of oxygen per liter of lake water). DO is essential for aquatic life because fish and many other organisms need it to “breathe”.
Most of the lakes described as the “cleanest” in the report are shown to have DO concentrations above that reported for Table Rock Lake, but that doesn’t mean Table Rock Lake has “bad” DO. First, it’s important to understand that a single average value for DO is not suitable to assess a potential problem or characterize a lake as polluted. Second, aquatic life in Ozark lakes typically needs consistent concentrations of DO greater than 5 or 6 mg/L (see Missouri CSR referenced above). The single value used in this report is well above that minimum threshold.
This is a great example of how scientific conclusions must be based on context rather than simply ranking numbers.
So, for those of you who are still asking the question — how “clean” is Table Rock Lake? We would love to tell you!
Like many lakes across the country, Table Rock Lake faces real environmental pressures. It’s listed as impaired because high total nitrogen and chlorophyll-a affect its designated use for aquatic life. Chlorophyll-a is a common indicator of the amount of algae in the water, and high nitrogen levels can contribute to excessive algal growth.
H2Ozarks, partners, and landowners across the watershed are actively addressing these impairments through watershed planning efforts. By identifying sources of pollution and implementing practical solutions, we are working to improve water quality in Table Rock Lake and protect aquatic life, recreation, and natural resources that make the lake so valuable.
In other words, there are real water-quality challenges we’re working on, but that is very different from saying Table Rock Lake is one of the “dirtiest lakes in America.”
If you’re concerned about water quality in Table Rock Lake, there are great ways you can get involved and make a difference. Understanding the facts is one of the first steps to making meaningful progress. The next time you see a bold headline or strong claim about something you care about, we hope you pause and think critically about how the data is presented. With better understanding, we can all be better stewards of the waterways we love and cherish. Because, if there’s one thing we all know without a doubt, it’s that our Ozarks waters are too precious not to protect.